
Let’s get down to bits and bytes! Abstraction is great, but sometimes it’s useful to dig down. In this GOTO Copenhagen session, we’ll explore exactly how Swift lays out data in memory, including both your own variables and Swift’s internal data structures. We’ll build a program to recursively scan memory at run-time to dump out everything we want to know, then walk through its results and what they mean, and compare and contrast with how C and C++ store their data.
Introduction (0:00)
A little bit about myself: I’m online at mikeash.com. I have a blog where I do all sorts of crazy stuff. I enjoy taking things apart to see how they tick and I have a bunch of crazy Github projects which you should probably never use for anything, but are lots of fun to play with. I’m on Twitter if you feel like following me. I also have a cat and as you know the internet is all about cats, and we are fundamentally all about the internet these days. I also have a lot of fun flying gliders.
What is Memory? (1:55)
Fundamentally, memory is what stops endless repetition from happening. You have to keep track of where you are. If you have a computational process, and you can’t keep track of that state, then you will simply never get anywhere. Figuring out how to build hardware which can remember things and store information to dig out later is one of the fundamental problems in computing. There have been lots of technological developments to improve how we solve this problem.
The first solution was vacuum tubes. They were very large, essentially incandescent light bulbs that each hold one bit. So if you wanted to store some reasonable amount of data you would have to have a room full of incredibly hot equipment.
Later on there were mercury delay lines, which was a large pipe filled with mercury that had something like a speaker at one end and a microphone at the other, used to pulse your data through the mercury. Since it takes time for the information to travel down the tube, it can be used to store data.
Magnetic core memory was small rings of iron with wires running through them, and depending on the electrical current you sent through them, you could store or retrieve data using the magnetic field in those rings, with one ring per bit. In the ’60s or ’70s a cube about the size of a shoe box could hold 32,000 bits of information. For comparison, a smartphone can hold many billions of bits.
DRAM or dynamic RAM, basically silicon chips, is what we use today, and it makes our lives a lot easier. These small chips allow us to store billions and billions of bits of information all at once.
In the Eyes of a Programmer (4:38)
We don’t care too much about hardware most of the time if we’re programming, because that all just works. So how does memory look for a programmer?
The fundamental unit of information is the bit, which is 1 or 0. Traditionally we organize bits in groups of eight, called bytes. Memory is just a long sequence of bytes, one after the other, heading off into the mist. But they are arranged in a certain order. Every byte gets a number called its address. We start at zero, and in an eight billion byte system, we’ve got billions off into the distance.
Often we view memory organized by word instead of by byte. A word is a vague term in computer science, but usually it means a unit that’s the size of a pointer. On modern devices 64 bits is expressed as 8 bytes.
Memory is usually mapped in hexadecimal. Hexadecimal is where you use base 16 addressing instead of base 8. The numbers increase from 0 to 9 and then A through F, before working back around to 10. Using base 16 gives a multiple of two allowing everything to fit together nicely. Hexadecimal is used as the native language of computing.
Big Picture (6:18)
The way that memory is mapped is different for every platform, but essentially, there is a gap in memory of stuff that doesn’t exist. To elaborate, the first four gigabytes in memory is not mapped, but it doesn’t take up any physical space, it is simply an addressing trick. After this gap, there is the user program. After the chunk that’s allocated for your program is another large gap, followed by the kernel. So 2-to-the-64th-power bytes are sliced up and organized in the this way.
To get more detailed, we will look at pointers in memory. Pointers are just references, and at this level, a pointer is a number that happens to correspond to the address of something else in memory. So here we have a value that stores the address of another value somewhere else in memory.
In the most modern systems, data is stored in little-endian order, which essentially means the least significant part of the number comes first. For example 234 would be written as “432.”
Parts of Memory (8:11)
Memory is organized into three fundamental parts.
-
The Stack * The stack is where all your local variables are stored when you write variables that are used in computations or in a function. It’s called a stack because every time you make a function call, it adds that function’s local variables on top of all previous things in the stack. So if you make another call it gets added to the top of the stack. When you return back from a function, the data at the top of the stack gets removed. So it mimics a physical stack of items.
-
Global Data * Global data are things that came along as part of the program when you loaded it. This includes global variables, string constants, type metadata, etc.
-
The Heap * The heap is dynamically allocated data. For example, when you create a new object, some memory is allocated on the heap. Everything on the heap has some lifetime; nothing lives there permanently. Things come to life and go away arbitrarily, things aren’t tied to your functions or your programs. * Memory is allocated on the heap when: – You create a new object – You allocate memory manually – You concatenate strings – etc.
Dumping Memory (9:46)
Let’s dive in and inspect the contents of some memory. I wrote a program that goes into memory and traces memory out. You can download the program here. It requires Xcode 8 and Swift 3.
The fundamental unit of this program is a function that looks like this:
	func bytes<T>(of value: T) -> [UInt8]{
		var value = value
		let size = MemoryLayout<T>.size
		return withUnsafePointer(to: &value, {
    		$0.withMemoryRebound(
				to: UInt8.self,
				capacity: size,
			{
				Array(UnsafeBufferPointer(
					start: $0, count: size))
			})
    	})
    }
This function works on an arbitrary type, takes a value and returns an array of unsigned 8-bit integers, or bytes. After you create an arbitrary item, calling this function and passing it that item and it’ll hand you back the bytes that make it up. This will serve as the foundation for this whole program.
How do we write this in Swift specifically?
This one possible implementation is not what the program actually uses, but it gets the ball rolling as far as how this works.
The idea is, you get the value and its size because we know the type of the value. Since this is a generic function in Swift, it works on any type, but it knows what type it’s being called with at any given time. This memory layout type allows us to get the actual size, telling us how many bytes it is, so that we know how long it is in memory. Next we use a built-in Swift function by passing it a variable and it returns a pointer to that variable. Once we have a pointer, we can look at that pointer as if it were a pointer of a different type.
Imagine you have a pointer to an int. We then perform a memory rebound call and pretend that this is not a pointer to an integer, and instead pretend this is a pointer to bytes. This takes a pointer to whatever arbitrary thing you’ve got and says, pretend this is just raw bytes, interpret it that way. Once we have the bytes, we can go through and just read them one by one which is a bit of a shortcut. I just tell the system to read it for me, there’s no loop or anything like that. Unsafe buffer pointer lets me say it’s a container and then I can create an array from that. Swift lets you write shortcuts like that.
For a demo of what this produces, I created a variable that contains one, two, three, four, five, six, seven, eight, and then I dumped out the value 42.
	let x = 0x0102030405060708
	print(bytes(of: x))
	print(bytes(of: 42))
If I print these calls, I get these results:
	[8, 7, 6, 5, 4, 3, 2, 1]
	[42, 0, 0, 0, 0, 0, 0, 0]
The first one prints out exactly what we saw, except it’s backwards because remember modern systems tend to do things backwards. And then 42 comes out in the second call as “42” with a bunch of zeros after it because it’s a 64-bit integer.
A Hexadecimal Implementation (13:31)
	func hexString<Seq: Sequence>
 		(bytes: Seq, limit: Int? = nil, separator: String = " ")
 		-> String
	where Seq.Iterator.Element == UInt8 {
 		let spacesInterval = 8
 		var result = ""
 		for (index, byte) in bytes.enumerated() {
 			if let limit = limit, index >= limit {
 				result.append("...")
 				break
 			}
 			if index > 0 && index % spacesInterval == 0 {
 				result.append(separator)
 			}
		 	result.append(String(format: "%02x", byte))
 		}
 		return result
	}
Hexadecimal is the natural language of low level computing. This takes an array of bytes and dumps it out as a hexadecimal string instead of as a sequence of decimal integers like we saw before:
	let x = 0x0102030405060708
	print(hexString(bytes: bytes(of: x)))
	print(hexString(bytes: bytes(of: 42)))
In hexadecimal these calls print:
	0807060504030201
	2a00000000000000
The numbers one through eight come out just as they did before, and then 42 comes out as “2a”, since that’s what 42 is in hexadecimal, followed by a bunch of zeros.
This lets us dump stuff out in a form we can understand, but that’s still close to what the computer has.
But real programs are more complicated than single values. They look more like this:
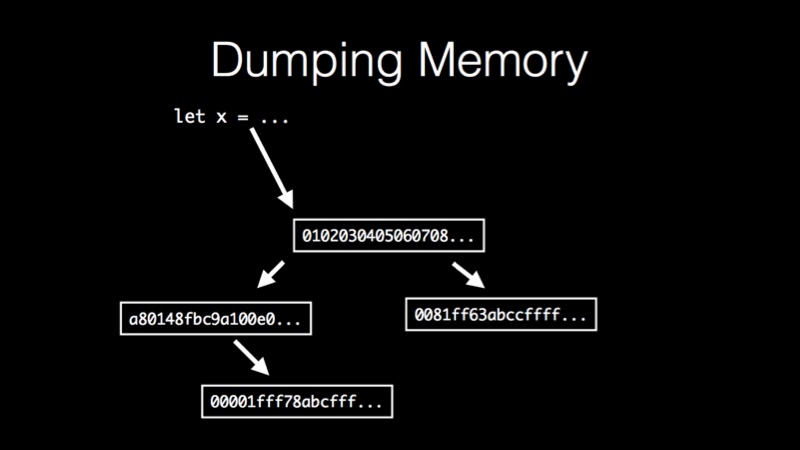
Here we have a value which contains a bunch of bytes and some of those bytes are actually pointers which point to other values and those point to other things and you get this whole tree structure. We want to be able to actually chase all this stuff down in an automated fashion. So how do we do that?
Pointers (14:52)
We start off with the knowledge that pointers are just integers. A pointer is just a number which we interpret as another location in memory.
So I wrote a struct which contains an address, which is an unsigned pointer sized integer. Wrapping it in a struct helps me keep things apart so you don’t confuse which parameters are actually integers and which parameters are integers which we are treating as pointers.
	struct Pointer{
		var address: UInt
    }
We make a new type so that the type system helps us write the program correctly.
This bit of code takes an array of bytes, which we already know how to obtain, and tries to scan for pointers in it:
	buffer.withUnsafeBufferPointer({ bufferPointer in
		return bufferPointer.baseAddress?.withMemoryRebound(
			to: Pointer.self,
			capacity: bufferPointer.count / MemoryLayout<Pointer>.size,
		{
			let castBufferPointer = UnsafeBufferPointer(
				start: $0,
				count: bufferPointer.count / MemoryLayout<Pointer>.size)
			return Array(castBufferPointer)
		}) ?? []
	})
To reiterate, a pointer is just an integer that you happen to treat as an address. We can’t know how stuff is being treated at this level because we just get a bunch of bytes and we don’t know what they mean. So we’re going to optimistically go through and slice it up into chunks of eight bytes. We take those chunks, pull them all out and ask, “What if these were pointers, what would that mean?”
So we take this array of bytes, and instead of treating it as an array of bytes, give me a pointer to its contents and treat it as a pointer to pointers. This means that we can go through and read the first pointer sized chunk, read the second pointer size chunk, read the third pointer size chunk, et cetera, and then return them as an array.
This is a visual indication of what’s going on with that code. We give it a value, it returns a bunch of bytes then we go through, slice it up and get the individual pieces. We can read a value, grab all of it’s bytes, then we can grab all of the pointers that those bytes might indicate. We then can take those pointers and repeat the process and essentially that gives you a tree-like structure. You can keep going through as long as you’ve got pointers to explore:
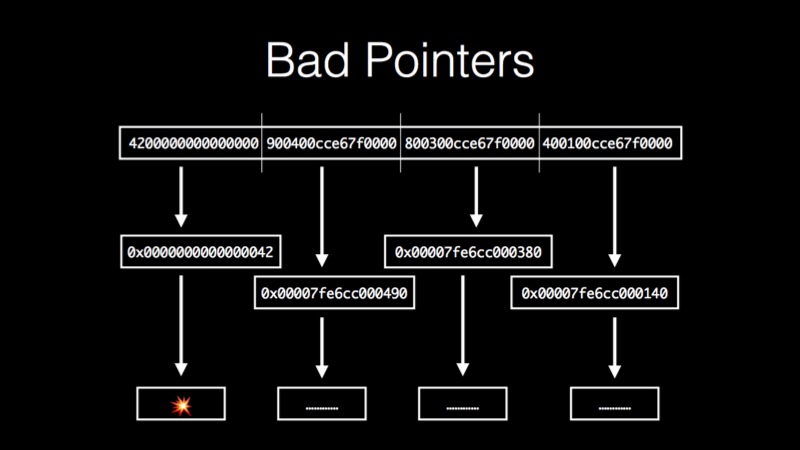
The problem with this approach is we don’t know which pointers are actually pointers and which pointers are just integers. The value might be the player’s high score, it might be the number of people who dislike you; we don’t know what each value means.
Normally in a program when you try to read from a pointer that’s not actually a pointer, it returns an illegal piece of memory, which crashes your program. This is good because you don’t want to proceed when your program is that confused. In this code, however, we want to keep going so we can explore. We want to be able to read from pointers without crashing if they’re bad.
On Mac and iOS, there is a low level function called mach_vm_read_overwrite. This is a system call where you give it two pointers and how many bytes to copy from one pointer to another. This call works exactly like memcpy from the C standard library except memcpy will crash your program if it is passed a bad pointer, and mach_vm_read_overwrite just returns an error because it is a system call. Since the call is performed at the kernel level, it can be checked safely and return an error saying that the pointer didn’t correspond to a real address. Because we can go through and reliably follow this tree without crashing we can try every pointer by passing it to this function. If it comes back with an error we just ignore it and move on to the next pointer.
Here is a function prototype that takes a task, which is like a process, and if you have the correct permissions, you can read from other processes. This idea is the really the foundations for building a debugger.
	public func mach_vm_read_overwrite(
		_ target_task: vm_map_t,
		_ address: mach_vm_address_t,
		_ size: mach_vm_size_t,
		_ data: mach_vm_address_t,
		_ outsize: UnsafeMutablePointer<mach_vm_size_t>!)
	-> kern_return_t
The function takes an address, a length, a destination address and a pointer to something where it will tell you how many bytes it actually read. One of the earlier examples showed a function that would read from a pointer, but it would crash if you gave it a bad pointer; this will read from a pointer safely.
	func safeRead(ptr: Pointer, into: inout [UInt8]) -> Bool {
		let result =
			into.withUnsafeMutableBufferPointer(
		{ bufferPointer -> kern_return_t in
			var outSize: mach_vm_size_t = 0
			return mach_vm_read_overwrite(
				mach_task_self_,
				mach_vm_address_t(ptr),
				mach_vm_size_t(bufferPointer.count),
				mach_vm_address_t(bufferPointer.baseAddress),
				&outSize)
		})
		return result == KERN_SUCCESS
	}
This code is essentially a wrapper around that mach call. It takes the pointer you give it, does a little bit of casting to get it into the form that the system wants and then it makes that call. If it succeeds it returns true, and if it doesn’t then it returns false. That way we can build a whole recursive scanning system.
How Much to Read? (20:17)
We can read this data safely, but we need to know how much to read. The first value we read, we can get the size of the type because we know the type at compile time. Since it’s a generic function, we get that metadata from the compiler, but after we start chasing pointers we can’t do that anymore because we’re dealing with arbitrary bags of bytes. We don’t know what this stuff is so we need to be able to at least guess how many bytes to read at any given time.
When following pointers through, for items on the heap there is the malloc size function. On iOS and Mac you pass it a pointer and it tells you how many bytes were allocated on the heap, telling us exactly how much we can read. This function is also tolerant of bad data; if you pass it something that isn’t a pointer, or a pointer that is legitimate but not allocated on the heap, or a pointer to something in the middle of another section of memory, it won’t crash, it will just return zero, which is perfect for our purposes.
Name Mangling (21:23)
And finally, we have global variables, code, and things like that. These are all symbols in your app. To check is something is actually a symbol we use the dladder function. You pass this function an address and it returns what symbol is nearby in memory.
We can also use this to extract size by scanning. dladder gives you the symbol that comes immediately before the pointer you give it. You can choose a starting address and get the symbol information back. If it returns that there is a symbol, advance one byte and test again, and continue testing and advancing until it returns false. This allows you to know exactly how long something is.
This function also gives the function names and your global variable names, etc. We can use these names to annotate our scan and help us understand what is going on. Those names in Swift and also in C++ tend to come up mangled because the compiler tries to embed information about what the type is besides just the name.
In C for example, if you have a function called summon, the symbol name that it spits out just says “summon”. In Swift if you have a function called summon the symbol name comes out with extra information because it will not only include that name, but it will also include the fact that it takes two integers and returns a string or whatever the actual method declaration is.
To help with that, Swift has a demangle function included with Xcode. If you pass it a mangled symbol, it returns something much more readable. This is very nice because if you give it something it doesn’t understand, it just gives it back to you unmodified. So I could just feed everything through it without fear that it would explode or crash.
C++ has a similar function called filt, which does the same job for C++ names and it has the same semantics; if you pass it something it doesn’t understand it gives it back to you without changing it. Because of this, I can just pass every name that I come across to these two tools.
Strings (23:49)
A lot of the data that we come across in memory is actually strings, textual information like method names and user input, and it’s useful to be able to find these. The trouble is, we’re working with bags of bytes, we don’t know what they are; they’re just a sequence of data and we want to be able to at least guess at which sequences of data actually represent text and which don’t.
While there is no way to do this reliably, a decent heuristic is to look for printable ASCII characters. Zero through 31 in ASCII are control characters, which we don’t expect to find as part of any interesting text in a program. In addition, characters beyond 126 are either the delete character or non-ASCII characters.
So we look for printable characters and we look for sequences of at least four. The idea is that if you just have one or two or three characters then it’s likely just some other data that coincidentally happened to look like text. Once you get up to four there’s a decent chance that it’s something textually interesting.
This process is not a guarantee, however it is a decent heuristic, yielding good results. Here is the code that implements this:
  let lowerBound: UInt8 = 32
  let upperBound: UInt8 = 126

  let pieces = buffer.split(whereSeparator:
    { !(lowerBound ... upperBound ~= $0) })
  let sufficientlyLongPieces = pieces.filter(
    { $0.count >= 4 })
  return sufficientlyLongPieces.map(
    { String(bytes: $0, encoding: .utf8)! })
If you pass it an array of bytes, it goes through and splits the array into chunks of continuous printable ASCII characters and then filters all the short ones, returning the long ones. This code can be run on byte arrays that we get out of the scanner to see what they contain.
Output (25:30)
So we can read all of this stuff, but we want to be able to actually output it in some form that’s nice for humans to look at. We could just dump it all in text form, but it would take a lot of work for the user to interpret. I use an open source program called Graphviz. You give the program a list of nodes with labels and a list of connections, and tell it what node is connected to what other node. After you pass all those things to the program it hands you back something like this:
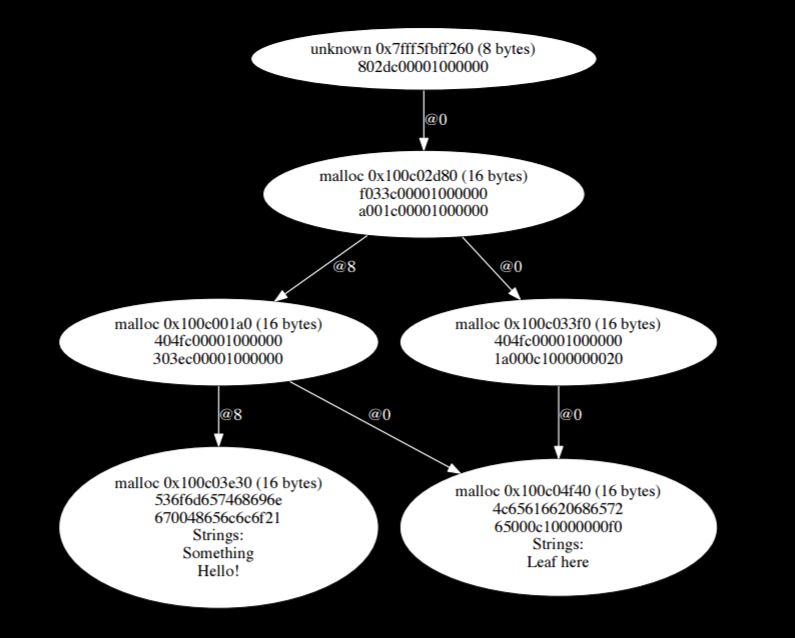
In this graphic, we can see we started with a pointer at the top that pointed to some malloc memory, which contained some data that pointed to more malloc memory, that pointed to more malloc memory, which continues all the way down until it points to some strings down at the bottom. Being able to see the whole structure visually helps us figure out what is going on.
Language Specific Memory Layouts (27:09)
The way memory is laid out is architecture specific. I performed these tests on a Mac running x86-64; iOS 64-bit is likely to be very similar, as well as Swift on Linux 64-bit. Though it’s architecture specific, it’s very useful for debugging and understanding how the system works.
It is not, however a good idea to write any code that relies on this unless it is a hobby project, or experimental, because offsets, sizes, the meaning of various fields etc. are likely to change from one release to the next. So it’s really useful stuff, but you don’t want to incorporate this into that library that you’re writing for work that will be shipped to users.
C (28:19)
C is very simple in how it lays things out in memory, which is much of the appeal for using C.
I made a C struct which just contains three long fields, x, y and z. I wrote a little bit of code that fills them with 1, 2 and 3 and then I dumped out that memory using my nice graphical dumper and this is what we get:
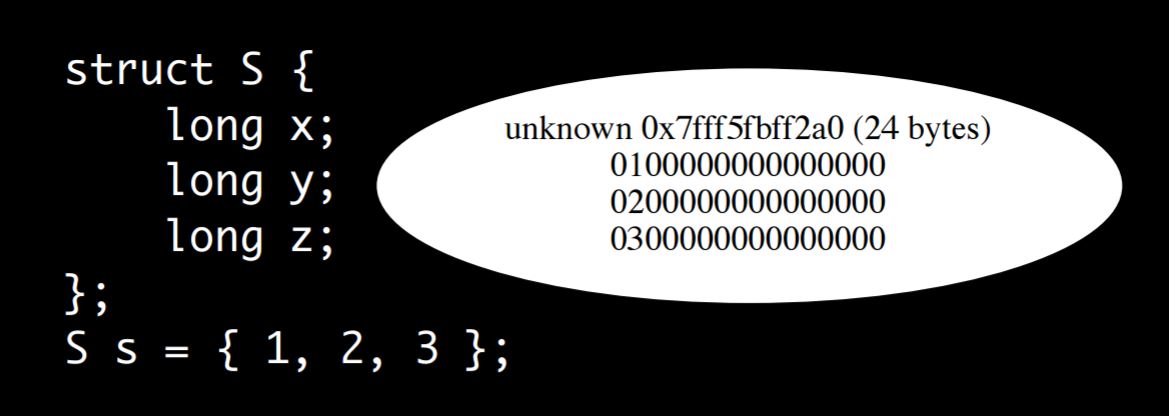
You can see that it essentially just lays them out sequentially. There is a lot of empty space as well, this is because a long is an 8-byte value, so since these are such small numbers, there are a lot of leading zeroes.
It gets more interesting when you use different sized elements. Here is a struct that has a bunch of fields of different sizes, “a” through “h”. The different sizes correspond to different data types; characters are one byte, shorts are two bytes, integers are four bytes, and longs are eight bytes. The compiler lays them out one by one in memory. If you look closely you’ll see that some of them take up more space than they maybe ought to. Number three for example, is one byte and corresponds to c. But if you look closely there’s three followed by zero followed by four, so there’s extra space in memory. This is because struct fields get padded.
The idea is that it’s more efficient to access data when it’s on a memory address which is divisible by its size, or at least is divisible by whatever the hardware architecture likes for it to have, which is typically its size. A two-byte value wants to be on an even numbered address, four-byte value wants to be on an address divisible by four. To create this, the compiler wastes memory by expanding the fields with space between them when necessary, but the program is faster.
That’s really all for C; C has structs and that’s about it. Memory is simply laid out sequentially, without metadata, without implicit pointers.
C++ (30:32)
However, C++ is more interesting. Here is a simple C++ class which has three virtual methods and one field:
class SimpleClass {
	public:
		long x;

		virtual void f() {}
		virtual void g() {}
		virtual void h() {}
	};

	SimpleClass simpleClass;
	simpleClass.x = 1;
I create one, initialize it and dump it out, and this is the result:
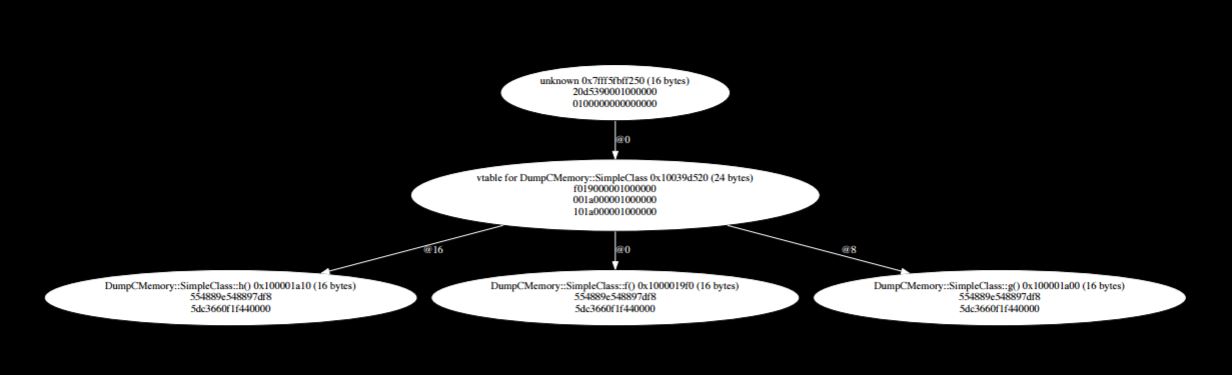
So we can see now it’s not just one bubble; the diagram contains many different things. Up at the top is the actual object, which was created, and contains its single field which contains the value one. Even though it only contained one field, there is so much extra stuff found by the program. The program explored the class and found that the top is a pointer that points to some data which points to more data. We call the item at the top a vtable pointer.
In C++ the way virtual method dispatch works is the first pointer sized chunk of an object is a pointer to a vtable. The vtable is a table of function pointers. So when you call through to something like object.x, what it actually does is use that table to look up the implementation of x for that object, implementing inheritance.
If you subclass something and override something, then that generates a new table and that new table contains new entries for those method implementations so that the code knows what it needs to call.
Here’s an example:
	class SimpleSubclass: public SimpleClass {
	public:
		long y;

		virtual void i() {}
		virtual void j() {}
	};

	SimpleSubclass simpleSubclass;
	simpleSubclass.x = 1;
	simpleSubclass.y = 2;
This subclass inherits from the previous example class, adds a new field and a few new methods. When the you dump again, the tree is expanded.
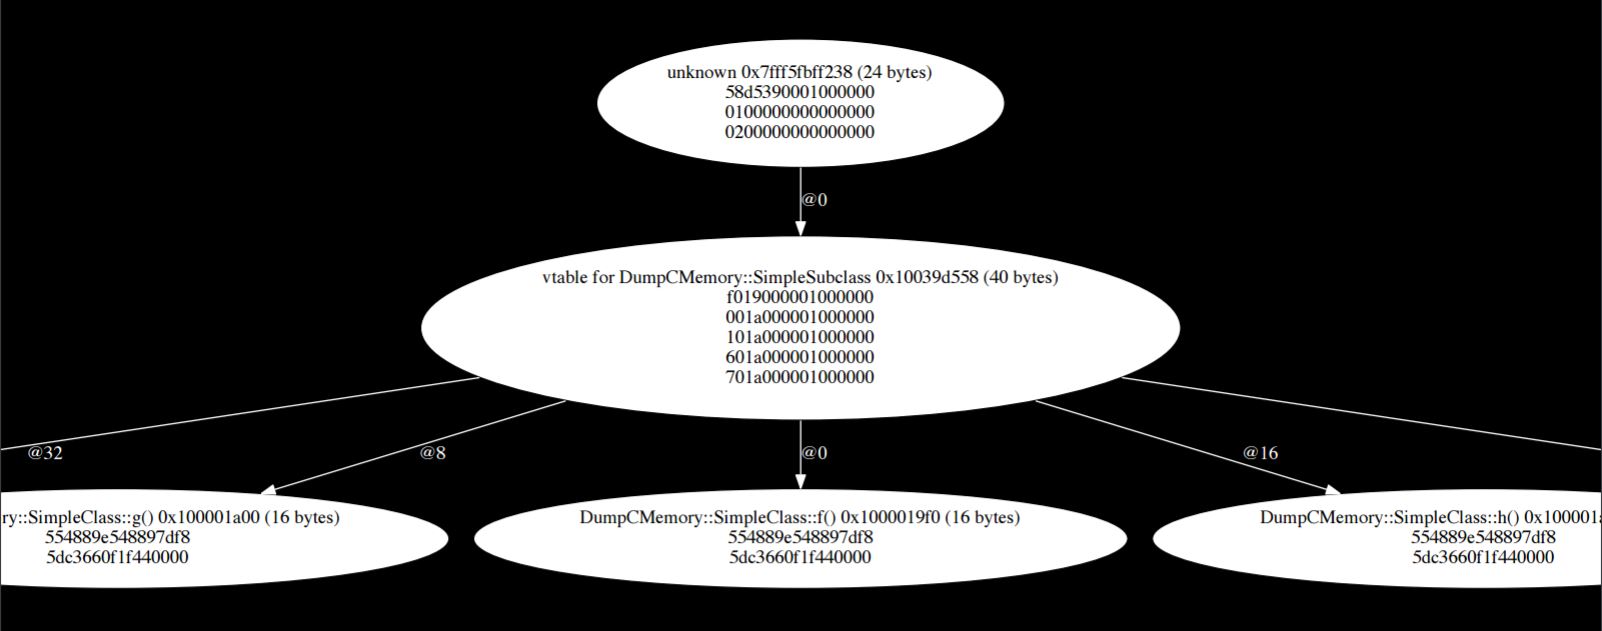
Like before there is this vtable pointer, and then the fields. Field number one is inherited from the super class, field two is from the subclass, and the two are laid out sequentially. The idea is that when the superclass is doing stuff it can look at the table and see what it thinks is itself, and then the subclass data gets laid out afterwards, avoiding conflict. Both the super- and sub-classes are packed into memory the same.
The vtable for the subclass is longer now because there are five methods; three from the super class, two from the subclass. These methods are also sequentially laid out in memory. Each method simply gets an index in this table and the subclass gets the same table as its superclass with the addition of whatever is inside the subclass.
Multiple Inheritance (33:05)
This is where things get interesting. C++ allows a class to subclass multiple classes simultaneously. So here’s a second superclass to go along with our original:
	class SecondSuperclass {
	public:
		long y;

		virtual void k() {}
		virtual void l() {}
	};
And here is a subclass of both:
	class MultipleInheritanceSubclass:
		public SimpleClass, SecondSuperclass {
	public:
		long z;
	};

	MultipleInheritanceSubclass
	multipleInheritanceSubclass;
	multipleInheritanceSubclass.x = 1;
	multipleInheritanceSubclass.y = 2;
	multipleInheritanceSubclass.z = 3;
To list what we have, each superclass has some methods, each superclass has a field, each subclass has a field. If we create the subclass and fill it out with some data, this is what we get:
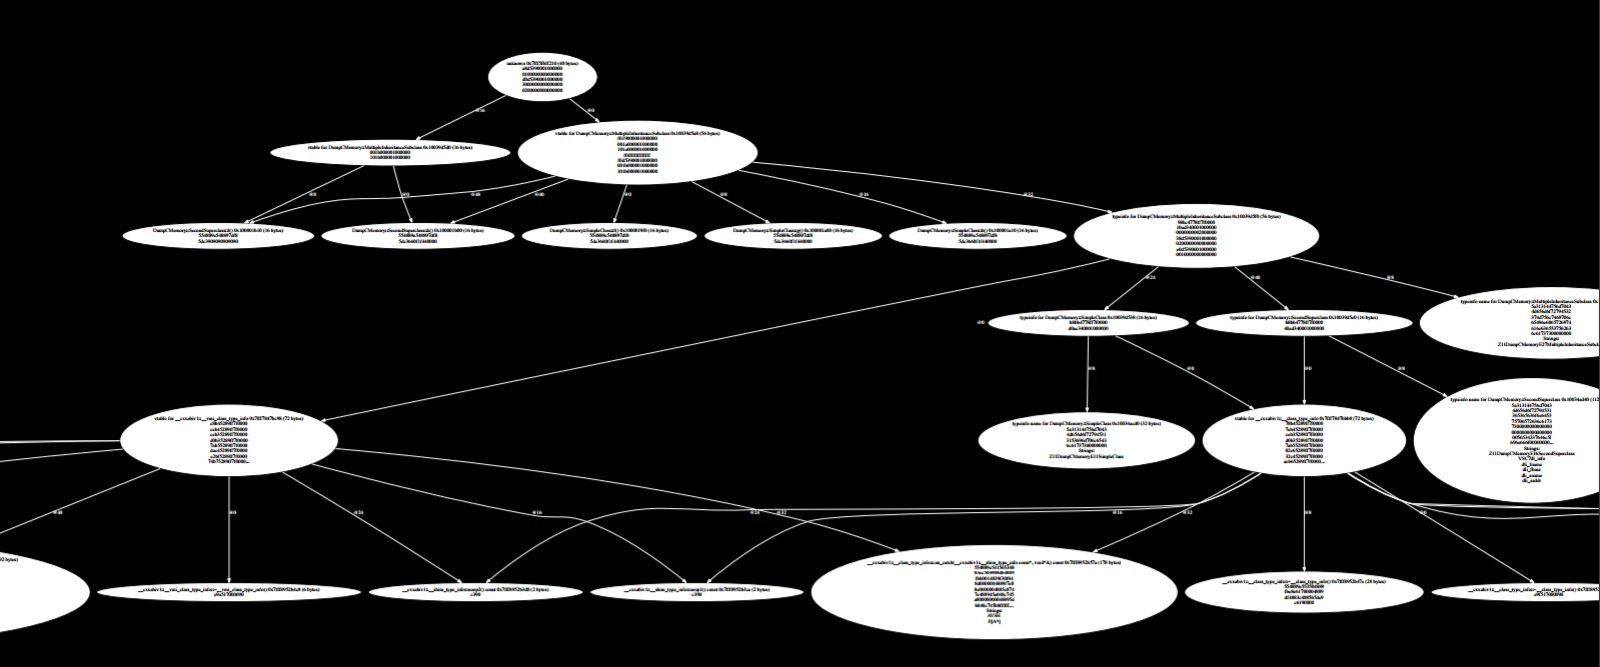
It’s more complicated. The good news is that most of that is runtime type information that we don’t have to look at too hard.
Again, the object is at the top and we can see that it starts out similarly to the previous example. It contains a vtable pointer followed by the first field, which is one, but then something interesting happens. Instead of doing just one, two, three, laying out all the fields sequentially, we get another vtable pointer right in the middle of the object. This is how C implements multiple inheritance.
There is one vtable pointer at the top, and there is another one in the middle. The idea is that it’s kind of like two objects glued together. The first vtable indicates that the subclass is an instance of the first super class, and then the second superclass gets laid out below it. What happens normally in C and with simple C++ classes if you cast between types, you tell the compiler to treat the object as an instance of its superclass. This is just some bookkeeping trickery, right? You’ve got the exact same pointer and you tell the compiler to pretend this means something else.
When you get multiple inheritance involved suddenly things get more complicated. If you say, “take this pointer and interpret it as a pointer to its superclass,” it will move that pointer a little bit. In this case it’s going to add 16 to that address and give you a pointer into the middle of this object. Since the second vtable is there, it all works out.
You can see the effect here where you’ve got essentially the vtable for the subclass and each part of this object. There are two vtables in the object, each one points to a different part of this vtable and everything lines up with these multiple superclasses. There is lots of compile time trickery, and then the end effect is at runtime everything is nicely laid out, friendly for the computer, and quick.
Swift (36:03)
Now Swift starts out very simple like C and C++. Here’s a struct with three fields. This is essentially the Swift equivalent of the C example I showed in the beginning with three fields.
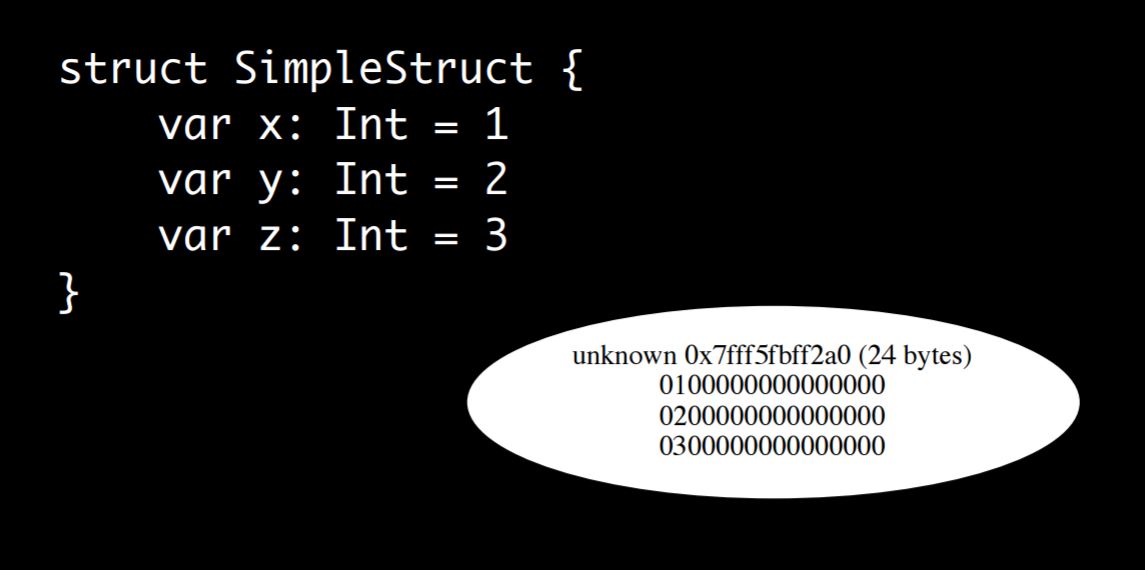
The way the result and output are laid out in memory looks exactly the same as it did in C. Swift lays out the fields as one, two, three in a row. There is not metadata, no extra stuff, just the fields are laid out.
I did the same thing that I did before with the multiple sizes.
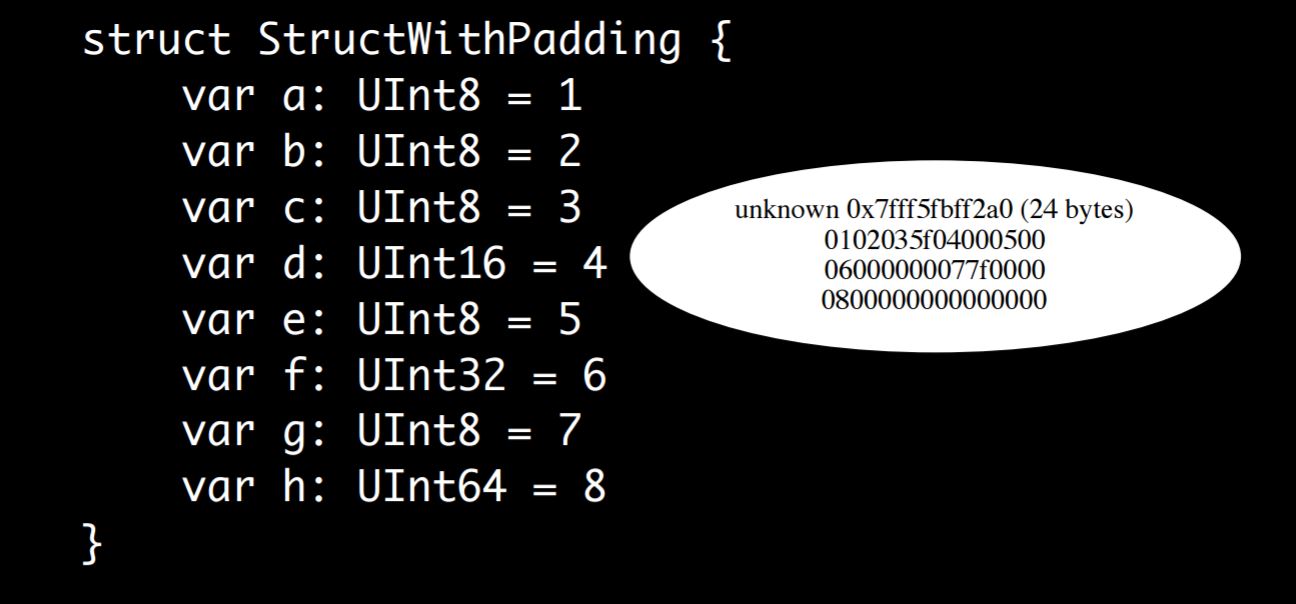
Again, we get the exact same result. This is a complicated struct with different fields of different sizes and the output is exactly the same as it was in C, with one exception. After three, you get one, two, three and then there’s the value 5f before four.
This is just because the padding that gets inserted does not have to contain any particular value because it doesn’t mean anything. Before when I ran the code on C it just happened to contain zero, and when I ran it on Swift it just happened to contain 5f. This is the junk DNA inside your program. Again, it’s just laid out exactly the same way C is, so there’s no overhead, it’s very straightforward.
Let’s look at a little more complicated example, let’s see how a Swift class looks.
	class SimpleClass {
		var x: Int = 1
		var y: Int = 2
		var z: Int = 3
	}
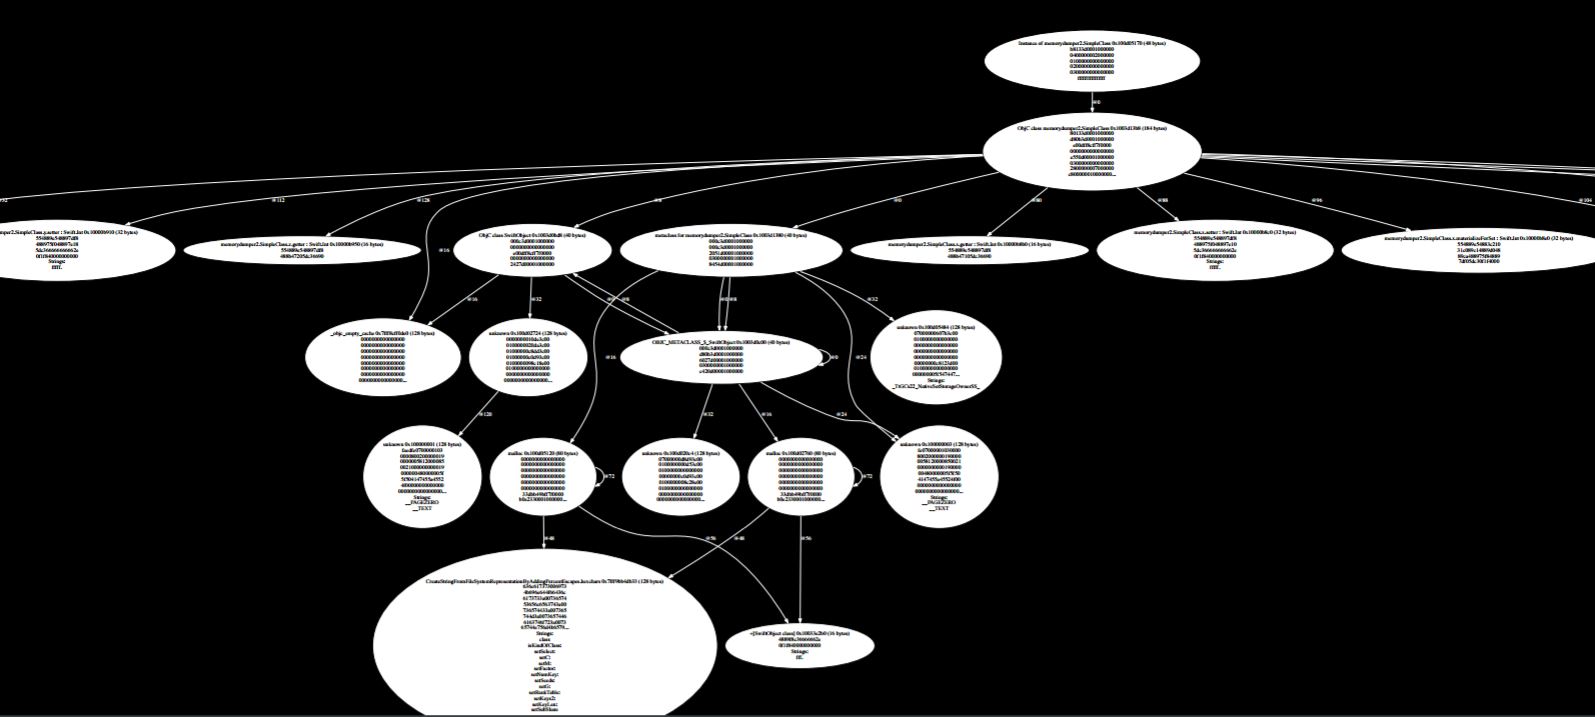
Simple thing, complicated result. Swift has this whole hierarchy of stuff and it knows what types mean at runtime. All this stuff outside the object is essentially saying that your class is actually a subclass of this heap in the Swift object class and that class has a metaclass, etc. If we zoom in and we look at the instance of the object, we can see the data laid out in memory, one, two, three, and there’s a header above it which is similar to the way C++ was.
In C++ we had a vtable and then there were the fields, and in Swift we have an isa pointer, which is essentially the Swift equivalent of a vtable. It points to the object’s class, then we’ve got some other stuff and then you’ve got the fields. There is the same arrangement of a header followed by the fields just packed in memory in a nice, linear, fast, hardware friendly manner.
Let’s take a look at a little bit more complicated class, this is the class equivalent of that struct that I showed:
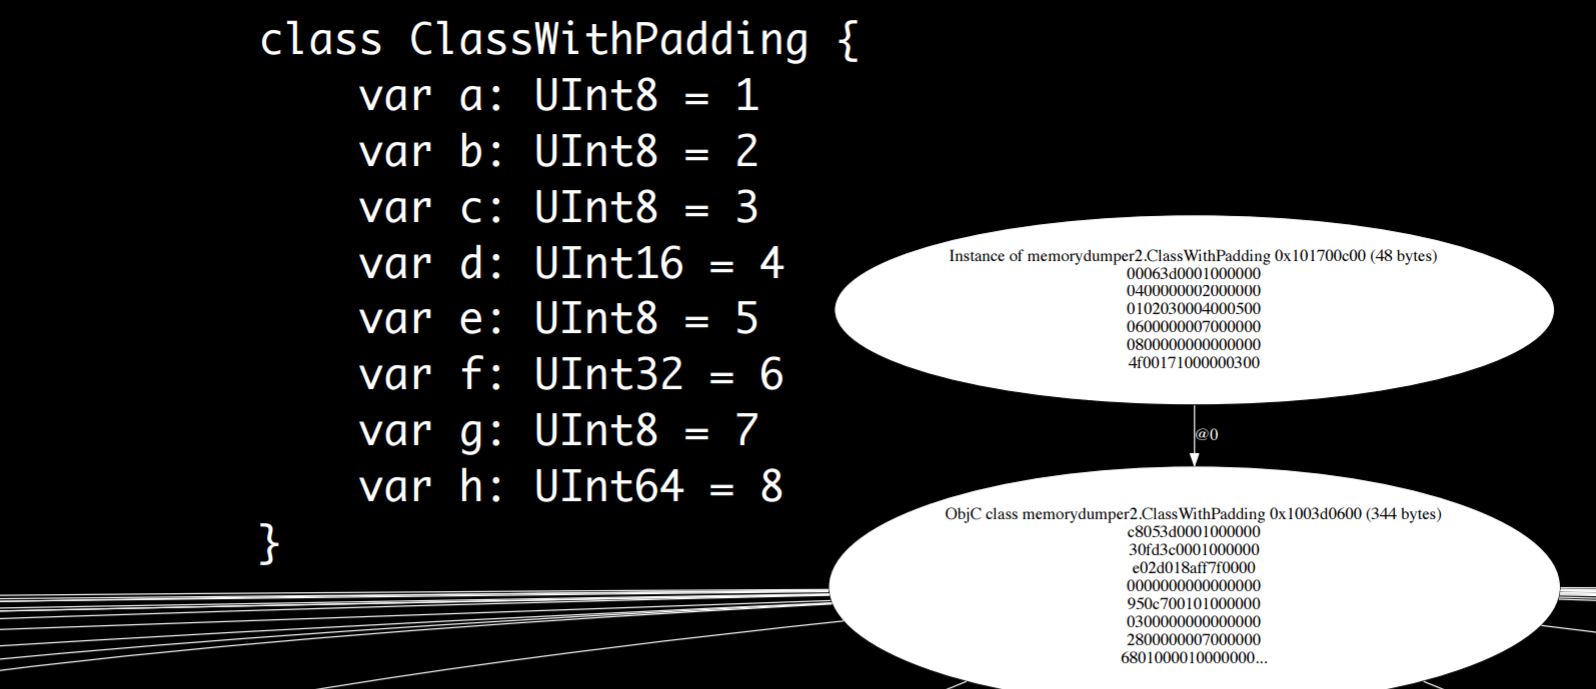
The result ends up being the exact same thing with that header put at the top. There is the isa pointer, there’s a bunch of other stuff, and then all the fields are laid out the exact same way they would be in a struct, that is, sequentially with some padding to make things line up nicely.
This is the visual representation, as those hexadecimal things get painful to read:
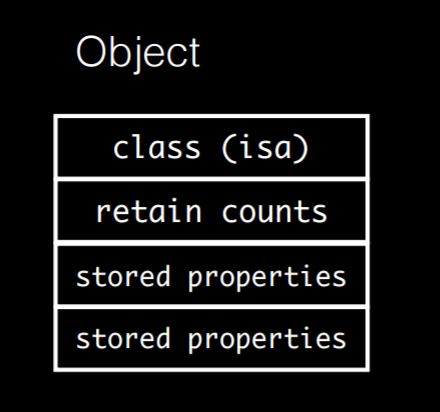
This representation shows the isa pointer and the other header field, the retain counts. Swift operates using automatic reference counting, so it needs to count the number of references to each object. In Swift those counts are stored in the object itself as the second header field. There are two counts in a Swift object, the strong count and the weak count. A normal reference to an object increments the strong count, and a weak reference to an object increments the weak count. The idea is that if the strong count goes to zero, and if the weak count is non-zero, the object is destroyed, but it is not deallocated. In short, there are two counts inside the same field, each one is 31 bits.
Now let’s look at that isa structure. The isa structure in C++ was the vtable which was just a list of method pointers. In Swift it’s a little bit more complicated partly because of Objective-C interoperability. Swift has to work with Apple’s Objective-C stuff and in fact all Swift classes in memory are also Objective-C classes. If you explicitly subclass an Objective-C class then you can see it, or if you use the at obj C annotation you can see it. But even if you do none of that and you create what looks like a pure Swift class, it’s actually an Objective-C class just the same.
To be more accurate, the first part of an object is not necessarily the isa pointer, sometimes it’s the isa pointer along with some other junk. This is just a way to efficiently pack metadata in there. Apple does this on iOS 64-bit, but I don’t believe they do this on the Mac currently. This is subject to change, but basically they can put extra information in there, like whether this object has ever had any associated objects with it that need to be cleaned up when it’s deallocated, things like that.
So what do these class structures look like?
Since every Swift class is also an Objective-C class, that means that we can look at Objective-C class definitions to see what’s going on. Objective-C class definitions are part of the Objective-C runtime which is open source. So we can just look in runtime.h in the open source dump.
Every class is also a valid object in memory. An object starts with an isa pointer, so that means every class starts with an isa pointer as well, which means every class is also an object.
A class has a class that’s called the metaclass and you can follow that rabbit hole all the way down until you get very confused. The class also stores superclass. That allows you to follow the chain up and essentially explore the class hierarchy. The class stores its name, it stores a bunch of other stuff, it stores how big it’s objects are, it stores a list of instance variables and methods and it’s got a cache which speeds up the methods dispatch.
	Class isa
	Class super_class
	const char *name
	long version
	long info
	long instance_size
	struct objc_ivar_list *ivars
	struct objc_method_list **methodLists
	struct objc_cache *cache
	struct objc_protocol_list *protocols
Swift classes take all of that and they add stuff because Swift has more going on. If you look in the Swift open source to see what’s involved there, there are some flags, there are offsets, and a lot of bizarre stuff, but essentially a Swift class is the Objective-C class with more stuff on the end.
	uint32_t flags;
	uint32_t instanceAddressOffset;
	uint32_t instanceSize;
	uint16_t instanceAlignMask;
	uint16_t reserved;
	uint32_t classSize;
	uint32_t classAddressOffset;
	void *description;
After all of those fields is a list of methods again, an array of method implementation. Which essentially is the C++ vtable approach again with some extra stuff at the top that we can ignore. What that means is that when you do a method call in Swift it translates into an array lookup.
You write obj.method() and that translates into code to take an object, get that isa field out of it, and then just index into it to get the method pointer and then you jump to it. You essentially make a function call based on that, which is very efficient at runtime.
Let’s take a look at what an object looks like when you subclass a bunch of stuff. I made a class, a subclass, a subclass of that and so forth, four levels deep.
	class DeepClassSuper1 {
		var a = 1
	}
	class DeepClassSuper2: DeepClassSuper1 {
		var b = 2
	}
	class DeepClassSuper3: DeepClassSuper2 {
		var c = 3
	}
	class DeepClass: DeepClassSuper3 {
		var d = 4
	}
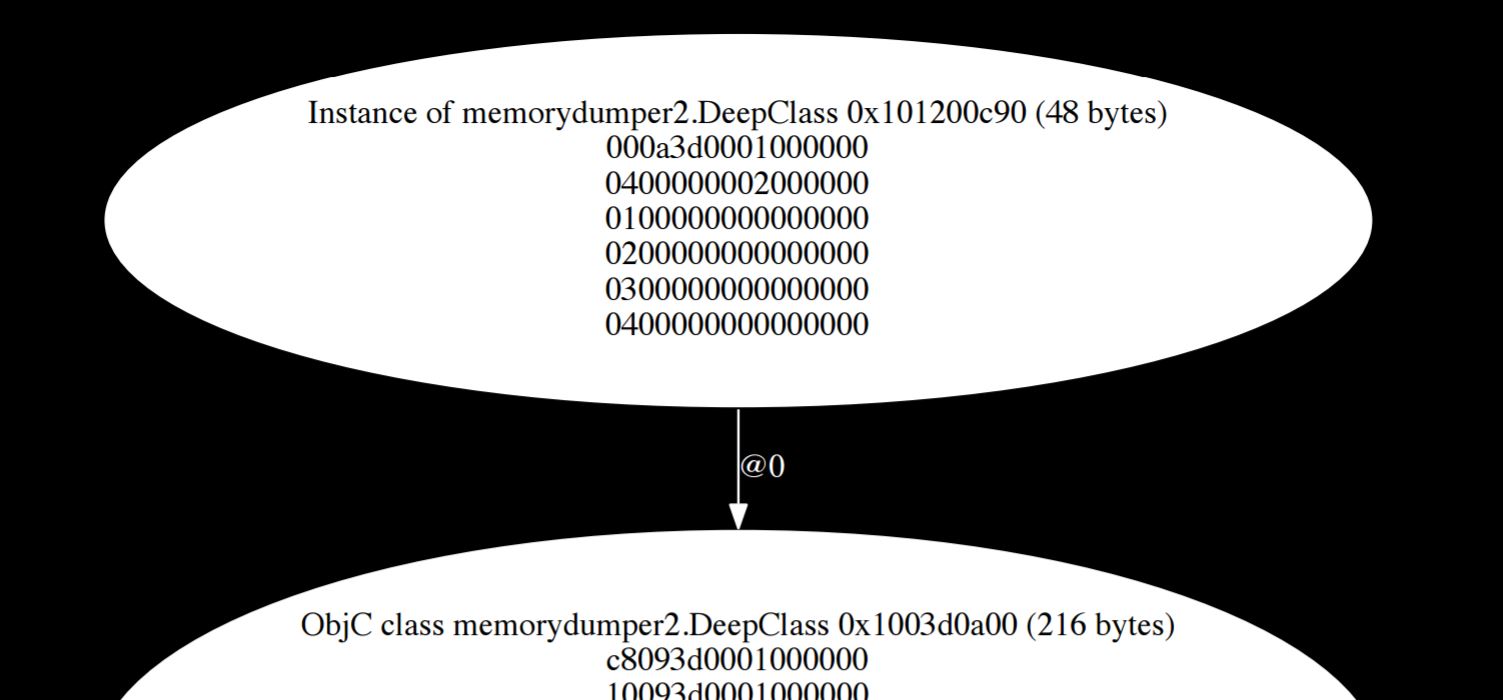
It looks exactly the same. There is an isa pointer at that top which tells you what it is, there are the retain counts below that and then the fields of all those classes just get laid out sequentially, just like in C++ we saw before. So at runtime it’s very simple, even though the class hierarchy we looked at was long and complex.
Arrays in Swift (45:15)
Arrays in Swift are value types, which means that they act like primitives. When you assign x = y that conceptually creates a new array which is separate from the original, but this dump reveals that’s a lie. They are, in fact, reference types under the hood.
So this array [1, 2, 3, 4, 5] - if you actually look at it it’s just a single pointer. Every array that you work with is actually a pointer to storage and when you make a new array you just get a new pointer to the storage. It’s only when you actually modify it, that it will go in and see that something else references this, and will create a copy and then modify that copy. It still references under the hood, you just don’t see it until you run a program like this.
Protocol Types (46:17)
This is an interesting aspect of Swift. Here’s a Swift protocol with three methods.
	protocol P {
		func f()
		func g()
		func h()
	}
Here is a struct which holds three instances of that protocol.
	struct ProtocolHolder {
		var a: P
		var b: P
		var c: P
	}
You can use a protocol as a type itself that can hold an instance of anything that implements that protocol. Here is a struct which implements it:
	struct StructSmallP: P {
		func f() {}
		func g() {}
		func h() {}
		var a = 0x6c6c616d73 // "small"
	}
It just has empty implementations of those three methods. It also has a field which is just an integer containing a hex value. That hex value will spell out the word “small” in ASCII. Basically that’s there so that when I do the dump we can identify it, because that string will show up in the printing.
Here’s a larger struct, with four fields.
	struct StructBigP: P {
		func f() {}
		func g() {}
		func h() {}
		var a = 0x656772616c // "large"
		var b = 0x1010101010101010
		var c = 0x2020202020202020
		var d = 0x3030303030303030
	}
The first hex value spells out “large” and the other ones just contain one, two, and three repeated so that they show up nicely.
And finally, here is a class, which is the same as the struct except it spells out “class” instead.
	struct ClassP: P {
		func f() {}
		func g() {}
		func h() {}
		var a = 0x7373616c63 // "class"
		var b = 0x4040404040404040
		var c = 0x5050505050505050
		var d = 0x6060606060606060
	}
We want to see how these get represented. So we create an instance of that protocol holder containing one instance of the small struct, one instance of the large struct and one instance of that class.
	let holder = ProtocolHolder(
		a: StructSmallP(),
		b: StructBigP(),
		c: ClassP())
If we dump it out here’s what we get.
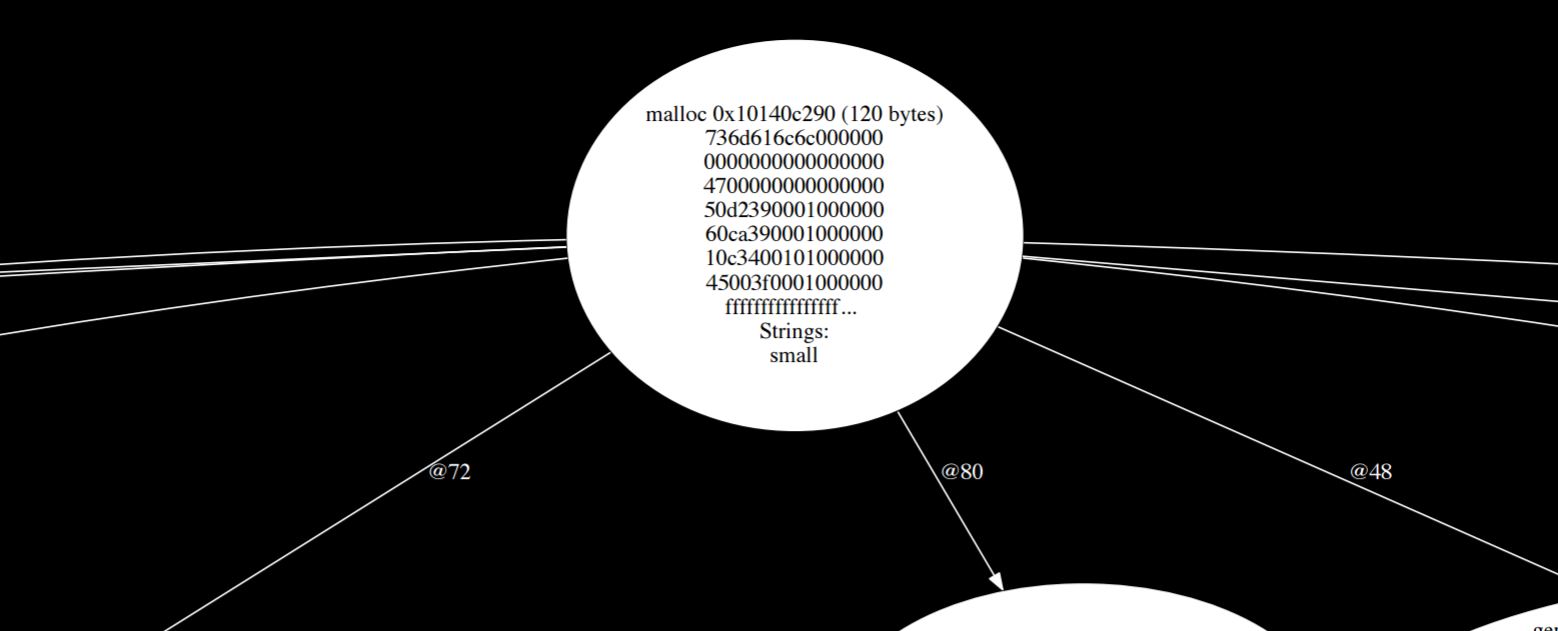
The larger view of this is very complicated, but we can see that struct in the list of strings that it found. It found “small.” So we can tell from this that that small struct actually gets stored inline. That field of protocol type is able to store that struct inline, but the large struct does not get stored inline and of course the class doesn’t because the class is a reference.
And where did that large struct go? Because structs normally get stored inline, but this one was large, it ends up getting stored off on the side here if you chase the arrows around. What happens is it’s too big to fit. The compiler can’t know how big these things are going to be so it places an arbitrary size limit and when you go over that limit then the compiler behind your back boxes it up, allocates something dynamically and stores it over on the side. “Large” gets stored off in the weeds somewhere.
If you chase it down you actually look at how these things are implemented. A value of protocol type holds five fields. It holds three arbitrary data fields and then it holds some type metadata, which essentially tells you what it is and then it holds a witness table which is like a vtable for the protocol. Those three data fields are given over to whatever the type needs them for.
If you’ve got a struct which holds that much stuff or less it gets stored inline very efficiently and everything is quick, but as soon as you go over that limit, suddenly it has to get broken out, it gets boxed up, it gets allocated dynamically and you lose a lot of efficiency. This is all hidden from you, you don’t notice it until your code gets slow. So the witness table is basically a vtable, it’s just an array of implementations just like the C++ vtable.
This means that when you make a method call on a protocol type it looks a lot like a method call on an object because you’ve got this special table just for the protocol. When you make a call with a protocol type like that, you look up the table by looking up the fourth word in the protocol and then you use the offset in the table that you know about because the compiler knows it’s that method and then you make the call based on the function pointer.
If you have a struct that’s too big, instead of having data fields, the first data field is actually a pointer to the real data. Everything gets stored off to the side. The methods here know that when they need to do their stuff they have to go up and chase that pointer and it’s all handled behind your back.
Enums in Swift (50:42)
Enums are very interesting in Swift. Swift has these high level enumeration types where you can have associated data or they can just be very simple things. Here is a simple case, just five cases with nothing associated with them, just A, B, C, D, and E, along with a struct that will hold them.
	enum SimpleEnum {
		case A, B, C, D, E
	}
	struct SimpleEnumHolder {
		var a: SimpleEnum
		var b: SimpleEnum
		var c: SimpleEnum
		var d: SimpleEnum
		var e: SimpleEnum
	}
	SimpleEnumHolder(a: .A, b: .B,
					 c: .C, d: .D, e: .E)
The result is those get laid out very succinctly. Each one gets a different number, they’re one byte long because we don’t need more than one byte to represent five values and it’s all very nice and compact.
Here’s a version with a raw value so you can actually go through and tell Swift, I want my cases to correspond to specific values:
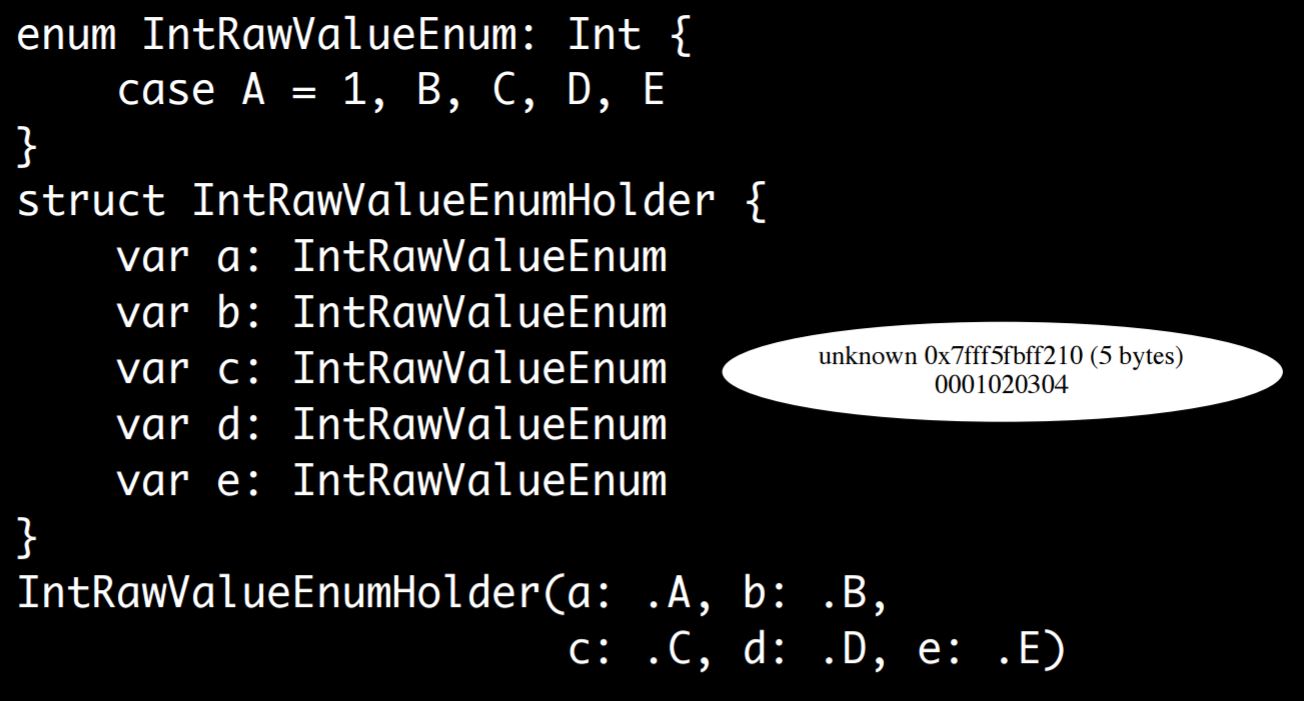
Interestingly enough, it does not change.
You can do string raw values:
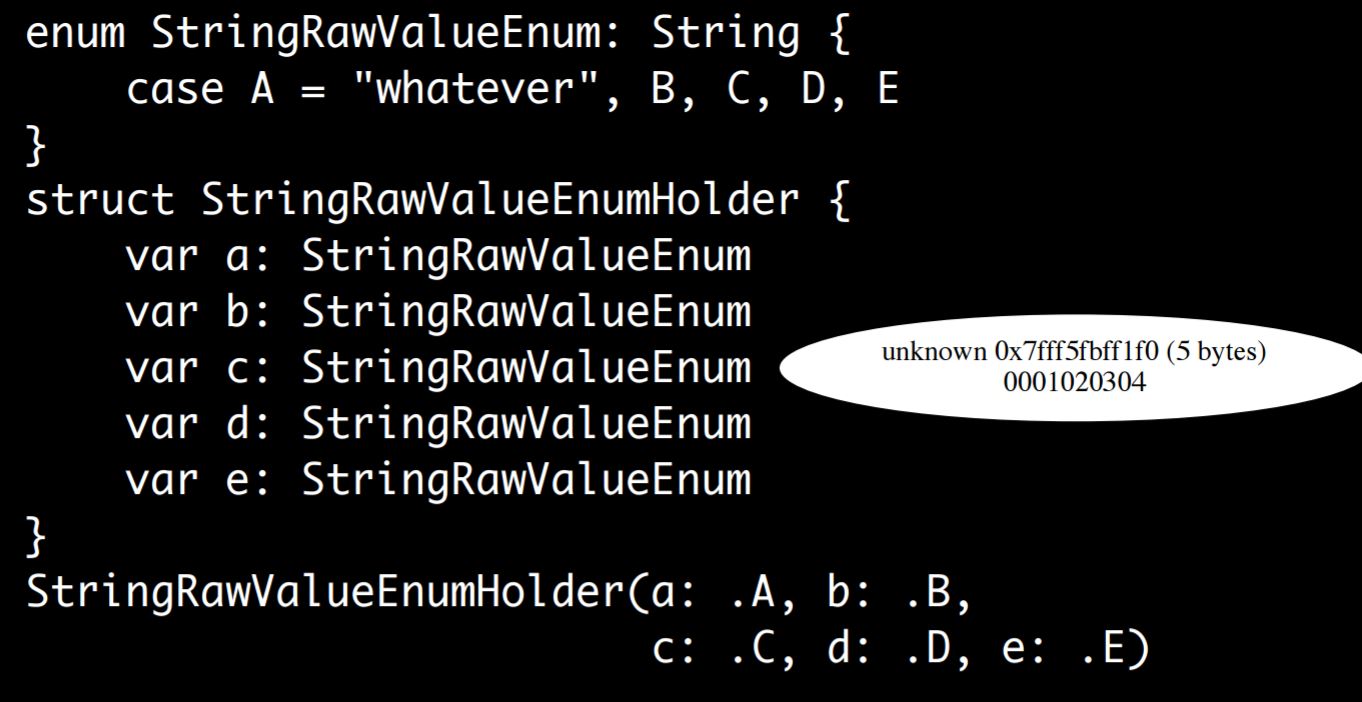
A is “whatever” and then B, C, D, and E get defaults. What’s going on here is the raw value can be stored off in a separate table somewhere, the compiler knows about it, there’s no per-instance raw value of any kind, so it can just be zero, one, two, three, four. Somewhere else there’s a table that says zero is “whatever”, one is B, two is C, and so forth.
Associated Objects (52:22)
Let’s look at associated objects. If we have an enum, and the first case has an object associated with it and the others do not and if we dump that out we find that it has expanded because it needs to be able to store that object pointer, but it has expanded intelligently. The first item is a raw object pointer and then the other ones are just small integers. The compiler is able to pack these so that it knows zero, two, four, and six can never be a valid pointer. So it’s able to use that to distinguish between those.
If we make it larger we have an enum with A, B, C, D, and E where they all have objects associated with them and suddenly everything gets bigger. Every entry is a pointer followed by an integer: object pointer zero, object pointer one, object pointer two, object pointer three. The number that gets assigned to each enum case and the associated value essentially get laid out next to each other. The compiler is able to pack them compactly for that one specific case, but not in the general sense.
Wrapping Up (53:28)
To summarize:
- There is real physical memory;
- there is conceptual memory;
- then there is the actual architecture of it all.
- C just lays things out nice and straightforward with a little padding.
- C++ objects get a vtable at the top.
- Swift objects get the same sort of thing, but with more stuff going on.
- Protocol values end up taking up five words of memory, and sometimes they can store data inline, but if you get too big they don’t.
- Enums end up being packed in many different ways depending on what’s going on.
You can learn a lot by poking around. It’s fun and useful.
Q&A (54:28)
-
Can you use Swift demangle with PO in Xcode when debugging? * I don’t think there’s any built-in way to do that, but what you can do is just copy and paste onto the command line. Swift demangle should be available in the terminal. * If you wanted to I’m sure you could build a little script. LLDB is scriptable through Python.
-
Any versus any object in Swift 3 and whether there are changes based on whether you import foundation? * I don’t think there would be changes in the layout based on what you import because there needs to be cross-compatibility between files that import foundation to files that don’t. So they would still need to be the same. In Swift 3 Objective-C objects as untyped objects now come in as any instead of any object, so there’s definitely a change there, I believe that’s just essentially a translation phase. Any I think looks like one of the protocol types where it’s a five word thing, it’s got three inline and it’s essentially storing things that way. Then there’s just a step where it takes that Objective-C pointer that comes in and puts it in one of those things.
-
How do the new debugging facilities in Xcode 8 compare to what we did today? * The new memory debugging stuff is really cool, you can go through and it will show you graphs like I showed here except they’re live. I haven’t played with it a ton, but I’m sure it’s going to be really useful. It’s more limited in that it has to work at runtime. I believe it will not trace C pointers and things like that, at least not beyond a certain point. It’s not going to be tracing global symbols and things like that. As far as looking at plain Swift objects, it’s really cool, it’ll show you the trees, it’ll show you this object points to that object. I think it’s going to skip over things like the pointers up to the classes, so it doesn’t give you everything. For what you care about day to day, it looks really cool, really useful.
About the content
This talk was delivered live in October 2016 at goto; Copenhagen. The video was transcribed by Realm and is published here with the permission of the conference organizers.